Profitability ratios Analysis

PROFITABILITY RATIOS & Margin Analysis
These ratios help the analysts to determine how effectively the resources of a business were used to manage costs, earn profit and create value for the providers of capital to finance those resources. Profitability ratios can further be classified into the following two categories.
-Few profitability ratios provide the return on investment made by the shareholders and other providers of finance i.e. the lenders of the company.
-The Other type of profitability ratio provides how well a business managed the costs to earn the revenues. In other words, these ratios highlight what were the margins of profits with sales made by the business. Both categories of profitability ratios will be explained in the coming paragraphs.
Usually, the higher results of profitability ratio are considered to be favorable, however, to reach any conclusion these results shall be compared with the other businesses of similar nature within the industry.
pinpoint the areas that need further examination before drawing a decisive conclusion and making better economic decisions.
Return On Capital Employed (ROCE)
It is considered the most important profitability ratio and provides how effectively the business’s resources were utilized to manage the costs and earn the profits to add the value for those who provided capital (i.e. Owner and Lenders) to finance business resources. Investment in any business is made to earn revenues and make profits. ROCE provides how much return a business generated over the total finances available.
To calculate Return of Capital Employed, Profit before interest and text is divided by the average capital employed during the reporting period. Whereas Average Capital is considered by adding the opening capital with the closing capital and dividing it by 2.
ROCE = Profit before Interest & Tax
(Opening Capital Closing Capital)/2
Further capital employed can either be considered as
-only the amount contributed by the ordinary shareholders or
-all long-term capital is provided by the shareholders and long-term financing lenders.
Similarly, if the capital figure is assumed as the investment from both shareholders and long-term lenders, then the profit before interest and tax will be taken for the calculation of ROCE. However, if the return on capital provided by the shareholder is being calculated then the figure of profit before tax will be taken into account. Return on capital employed encompasses all the other profitability ratios.
Businesses C and D in the following illustration, have made the same amount of net profit for an amount of $60,000 during the last accounting period, but the amount of capital employed in both businesses are different.
| Business 1 | Business 2 | |||
| $ | $ | |||
| Fixed + Current assets – Current liabilities | 150,000 | 190,000 | ||
| Capital accounts | ||||
| Opening balance | 125,000 | 165,000 | ||
| Add Net profit | 60,000 | 60,000 | ||
| 185,000 | 225,000 | |||
| Less: Drawings | (35,000) | (35,000) | ||
| 150,000 | 190,000 |
| A. Ltd. | B. Ltd. | |
| ROE= | 60,000 (125,000+150,000) ÷ 2 | 60,000 (165,000+190,000) ÷ 2 |
| 43.64% | 33.80% |
The ratio illustrates that what is important is not simply how much profit has been made but how well the capital employed has been used. Business A has made far better use of its capital, achieving a return of $43.64 net profit for every $100 invested, whereas B has received only a net profit of £33.80 per $100.
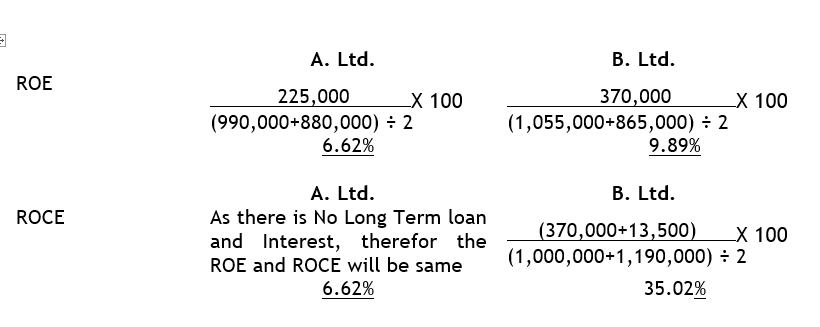
Let’s understand the ROCE with another illustration.
| A Ltd. | B Ltd. | ||||||
| $ | $ | $ | $ | ||||
| 2018 | 2019 | 2018 | 2019 | ||||
| Fixed assets | 730,000 | 790,000 | 845,000 | 955,000 | |||
| Net current assets | 150,000 | 200,000 | 155,000 | 235,000 | |||
| 880,000 | 990,000 | 1,000,000 | 1,190,000 | ||||
| 10% Loan note | – | – | 135,000 | 135,000 | |||
| Share capital (ordinary) | 400,000 | 400,000 | 600,000 | 600,000 | |||
| Reserves | 480,000 | 590,000 | 265,000 | 455,000 | |||
| 880,000 | 990,000 | 865,000 | 1,055,000 | ||||
| Total Equity and Liability | 880,000 | 990,000 | 1,000,000 | 1,190,000 | |||
| Profit and Loss Accounts for the year ended 31 December 2019 | |||||||
| Net Profit | 225,000 | 370,000 | |||||
| Dividend Paid | (115,000) | (180,000) | |||||
| 110,000 | 190,000 |
Gross Profit Margin Ratio
The gross profit ratio conveys the efficiency of business while producing and selling goods or rendering services. The gross profit ratio is derived after subtracting the cost of goods sold or services, from the sales divided by total sales revenue earned during the reporting period.
The gross profit ratio indicates how well businesses earn sales by making investments to produce goods or render services. This ratio also provides how much amount is retained from sales after subtracting the cost of goods sold or services rendered. This means that higher margins show that the company has more money to pay off interest and tax costs.
Net profit margin ratio
This ratio conveys the net profit earned by the business as a percentage of sales. Net profit margin shows the ratio of the amount retained from the sales for the owners of a business.
The net profit margin ratio is calculated by dividing the net profit after tax by sales revenue for the reporting period.
Taxes are paid to the authorities. Higher net profit margins are favorable and indicate this strong cost control exercised by the business during the reporting period.